 What If UniverseOpen the simulator
Sea level rise map
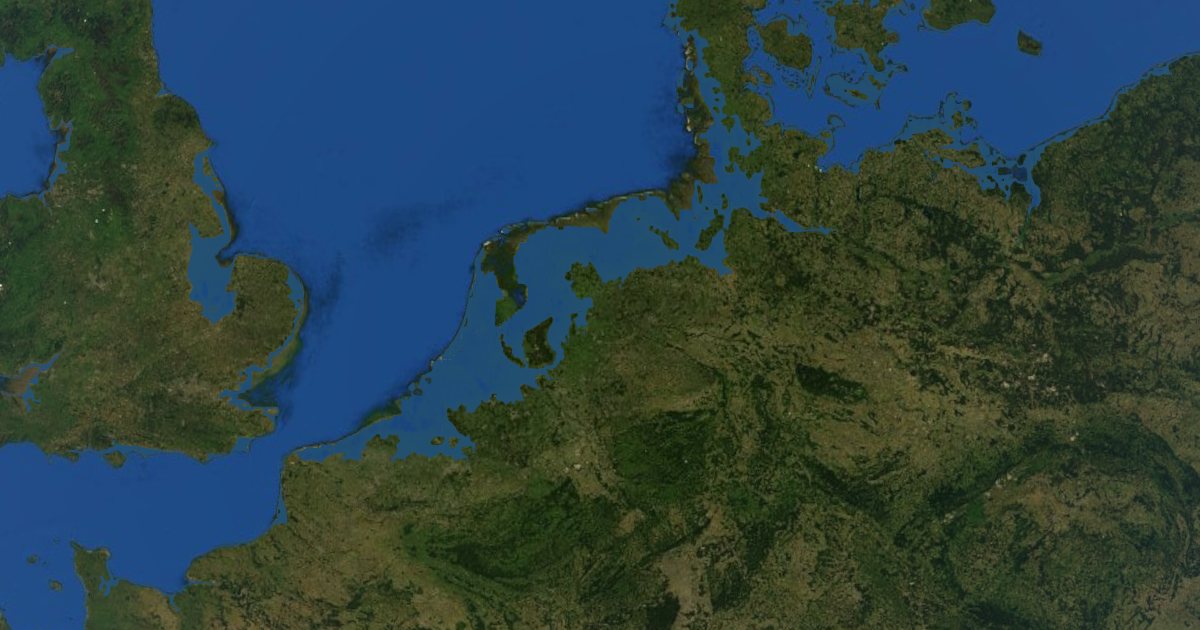
Drag the sea level up or down and watch the coastlines change on a 3D globe: from a 2 metre rise to all the ice melted, or every ocean drained to show the sea floor.
 Try it now: free, in your browser
What you can try
Raise the sea a little and the first places to go under are the river deltas and low coasts of Bangladesh, the Netherlands, Vietnam, Egypt and the US Gulf Coast. At 70 metres, with all the ice on Earth melted, whole cities and countries disappear. Click any spot to see its height and the sea level at which it would flood.
Go the other way and drain the oceans to see the mountain ranges, trenches and plains of the sea floor, or drop the sea by 120 metres to see the land bridges of the last ice age.
How it is worked out
Flooding follows real elevation data (Mapzen terrain tiles built from SRTM and ETOPO1) and ignores dikes and sea walls, so it shows which land lies below a given level. The people counter uses the GHSL population grid.
Questions
How much would the sea rise if all the ice melted?
About 70 metres. Most of it is locked in the Antarctic ice sheet, with about 7 metres more in Greenland.
Who lives on land that a small rise would flood?
Hundreds of millions of people live within a few metres of sea level, most of them in Asian river deltas. Click "+2 m" in the simulator to see the count and the worst-hit countries.
Does the map include dikes and sea walls?
No. It shows which land lies below the sea level you choose. Places like the Netherlands are protected by dikes today.
All numbers in the simulator are rough estimates meant to show what could happen, not predictions.